Agent Control Room
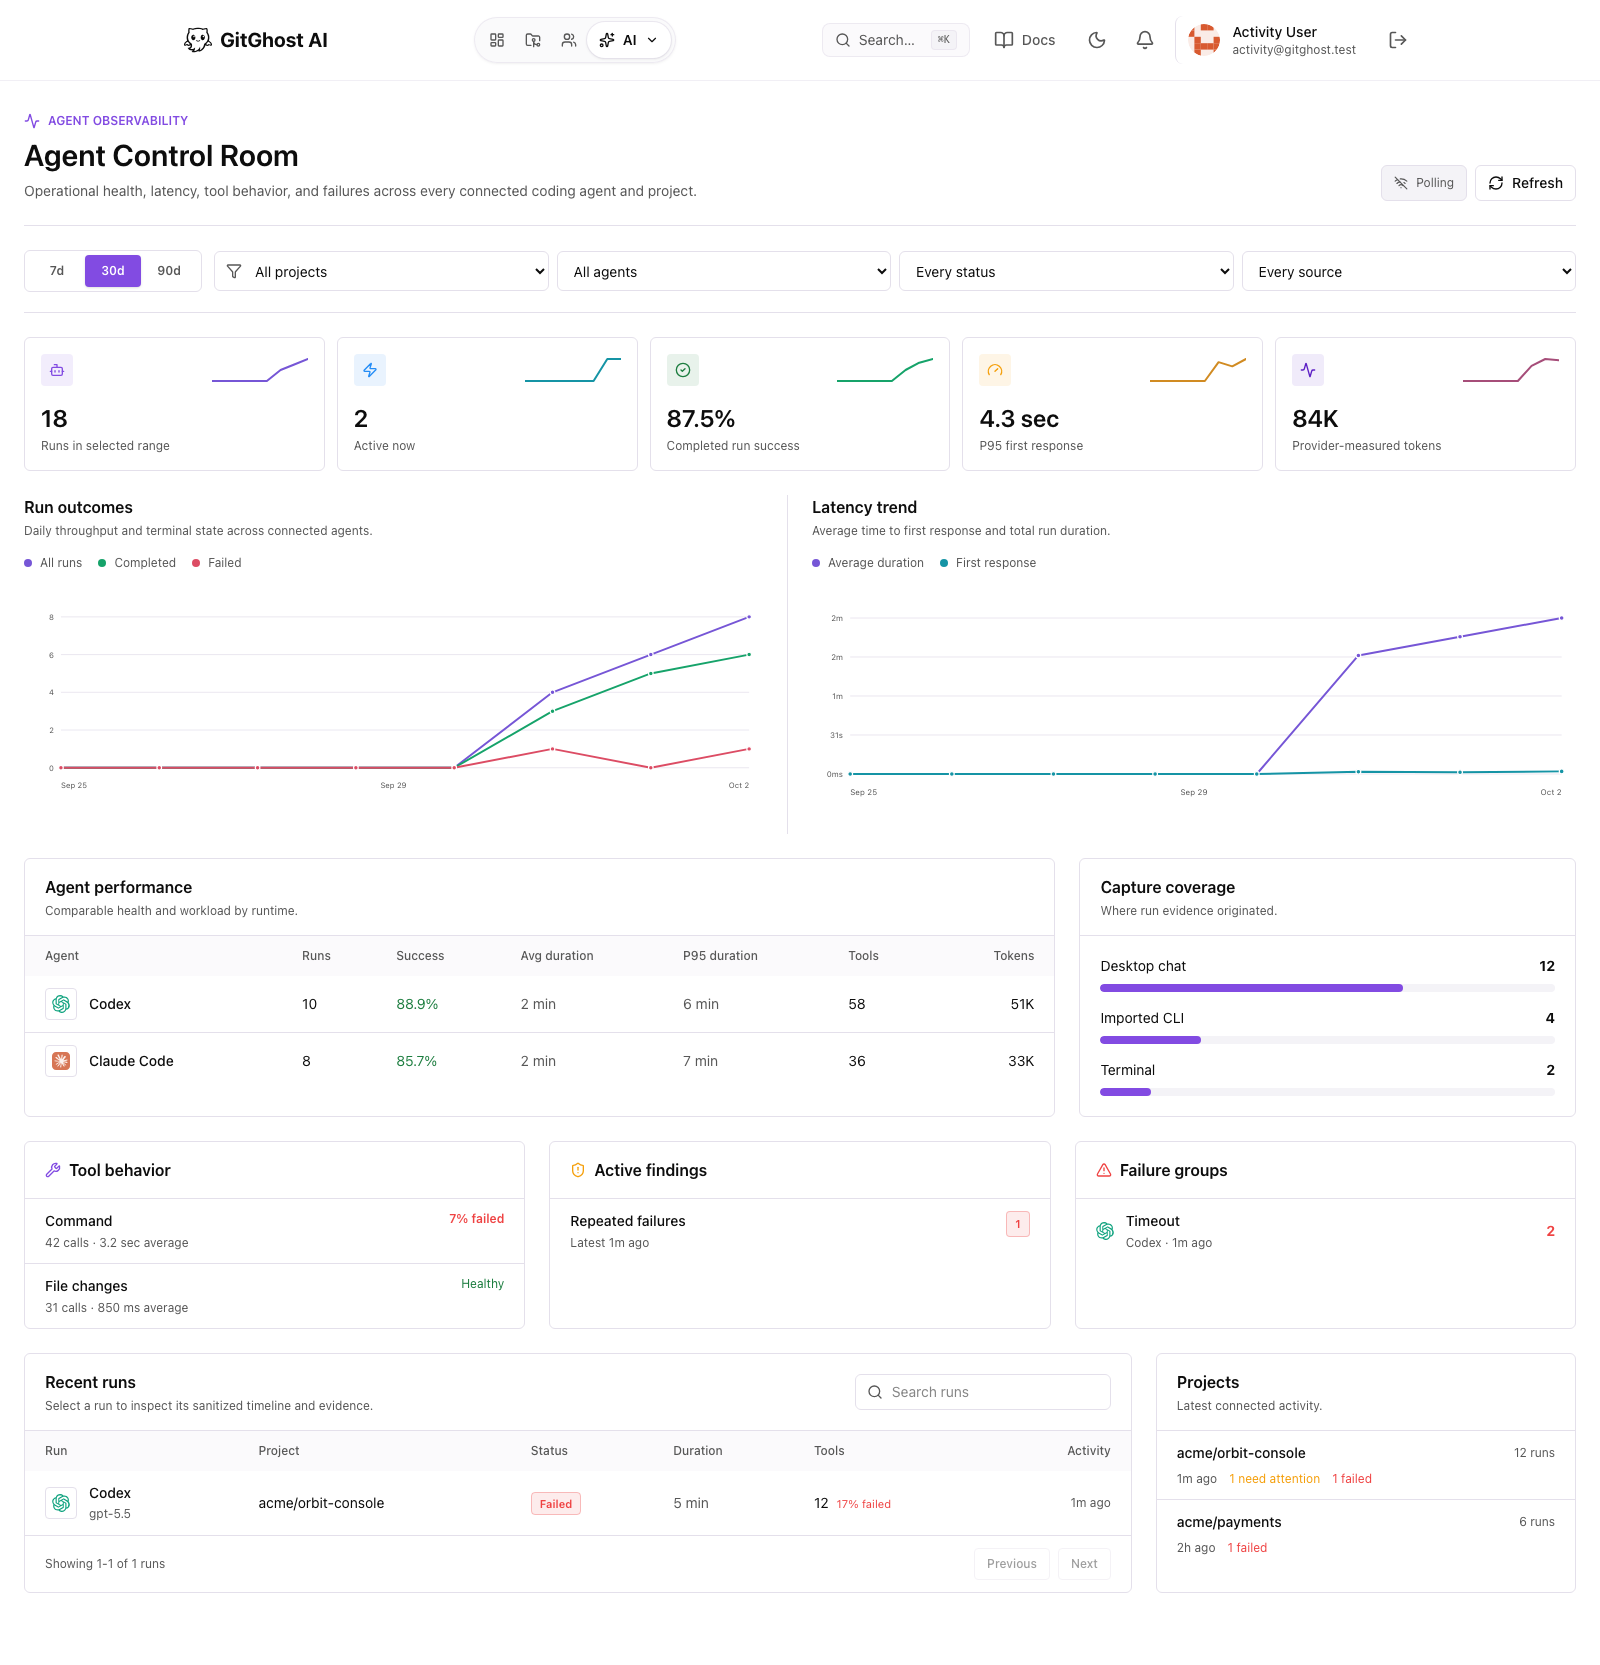
The Agent Control Room turns activity from GitGhost Desktop into one account-level operational view. Use it to see whether agents are active, slow, failing, repeatedly calling a tool, or waiting for attention across connected projects.
Before You Start
Cloud observability requires all of the following:
- Install a current GitGhost Desktop release and sign in.
- Open a local repository in the desktop app.
- Connect that workspace to the matching GitGhost project.
- Keep the project connection authorized for agent event synchronization.
- Start a structured agent conversation or an agent terminal from GitGhost Desktop.
The desktop app synchronizes automatically. You do not need to paste a token into a command or start a separate collector.
Open The Control Room
- Sign in at gitghost.ai.
- Open the AI menu in the dashboard header.
- Select Agent Control Room.
- Choose 7d, 30d, or 90d.
- Narrow the view by project, agent, status, or capture source when needed.
The page refreshes when GitGhost receives a new observability batch. It also polls periodically, so temporary realtime interruptions do not leave the dashboard stale.
Read The Health Summary
| Metric | What It Answers |
|---|---|
| Runs in selected range | How many agent runs GitGhost received for the current filters. |
| Active now | How many runs are working or waiting. |
| Completed run success | The completed share of runs with a terminal success or failure state. Active and stopped runs are excluded. |
| P95 first response | How long 95 percent of measured runs took to emit their first structured response. |
| Provider-measured tokens | Input, output, and cache tokens reported by supported agent protocols. Missing usage is not estimated. |
The sparklines show direction inside the selected time range. Use the larger charts below them to distinguish a one-day spike from a sustained change.
Use The Charts
Run outcomes compares all, completed, and failed runs by day. Look for rising failure counts, falling completion, or unexpected activity outside normal work periods.
Latency trend compares average run duration with average first-response time. A long run can be legitimate; rising first-response time across agents is more likely to indicate provider, network, or orchestration delay.
Agent performance gives each runtime the same columns: runs, success, average and P95 duration, tool calls, and measured tokens. Compare similar work and time ranges; different projects can have very different workloads.
Capture coverage explains where the data came from:
- Desktop chat is a structured conversation managed by GitGhost Desktop.
- Imported CLI is supported agent history the user explicitly opened or imported.
- Terminal records the lifecycle of an agent terminal without its terminal output.
Investigate A Problem
Use the lower panels before opening an individual run:
- Check Tool behavior for high call volume, failure percentage, and average duration.
- Check Active findings for deterministic warnings such as repeated failures, possible loops, long-running work, or an approval wait.
- Check Failure groups to see repeated failure classes by agent.
- Select a failure group or a row under Recent runs.
Recent runs shows the complete filtered history in pages. Use Previous and Next to move through older activity; the search field narrows only the page you are currently viewing.
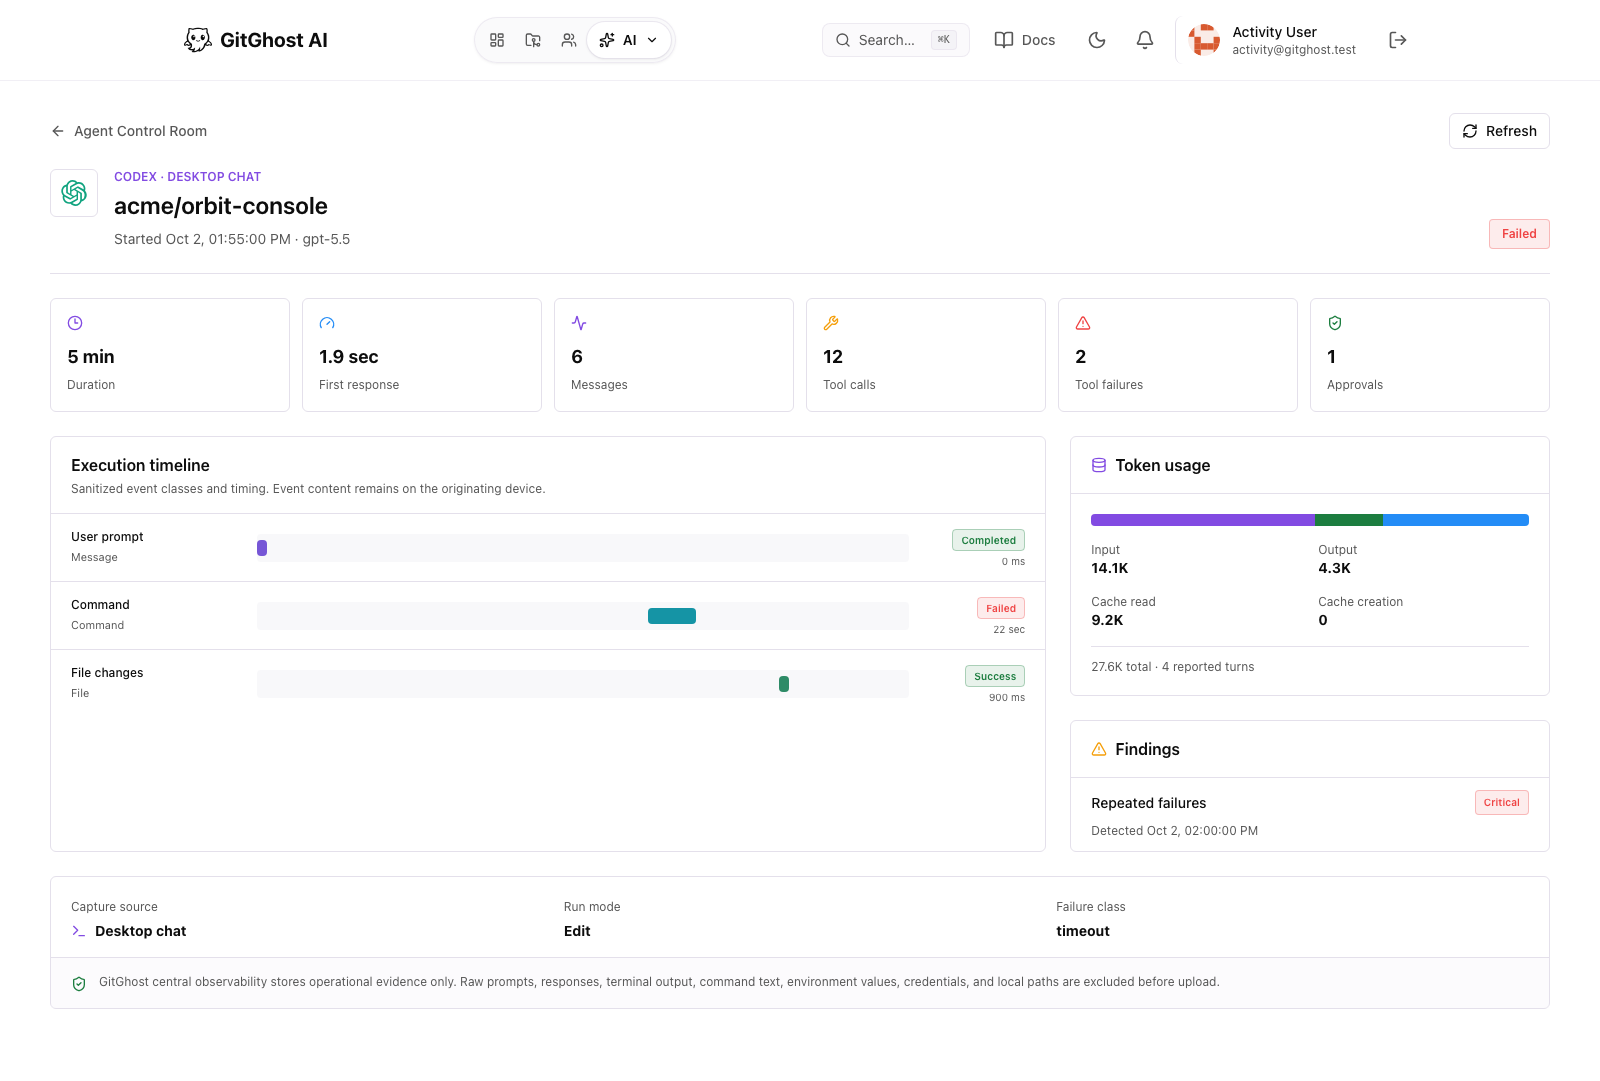
The run detail contains status, timing, tools, approvals, provider-reported usage, active findings, and a sanitized event timeline. Event names are fixed operational classes such as Command, File changes, or Integration tool. The cloud view does not contain the command, diff, prompt, response, or local path.
Local And Cloud Views
| Surface | Best For | Scope |
|---|---|---|
| Desktop Execution Ledger | Live work on this computer, local event details, and immediate troubleshooting. | Open local workspaces. |
| Web Agent Control Room | Cross-project trends, comparison, grouped failures, and access from another device. | Runs synchronized by your connected projects. |
| Web Sessions | Governed session evidence, checkpoints, action requests, and transcript capture configured by the Agent Protocol. | Captured project sessions. |
These views complement each other. An Execution Ledger run is not automatically a governed Session, and a terminal lifecycle does not become a terminal transcript.
Data And Privacy
GitGhost synchronizes only bounded operational metadata:
- opaque run and event identifiers;
- project and authenticated user ownership;
- agent, model identifier, source, mode, and status;
- timestamps, duration, first-response time, and counts;
- provider-reported token totals when available;
- fixed event classes, fixed failure classes, and deterministic finding codes.
GitGhost does not synchronize prompts, responses, terminal output, command text, diff content, local filesystem paths, environment variables, credentials, or hidden reasoning through this observability channel. Each user sees records uploaded through their own scoped project connection.
If Data Does Not Appear
- Open Observability in GitGhost Desktop and inspect the sync indicator.
- If it says Local only, connect the workspace to its GitGhost project.
- If it says Sync needs attention, confirm the desktop is signed in and the project connection still has agent event access.
- Keep the app online for the automatic retry, then use Refresh in the web view.
- Clear web filters and confirm the selected time range includes the run.
- For transcript, checkpoint, or action evidence, open Sessions instead.
Continue with Desktop Agent Observability, AI Sessions And Evidence, or AI Approvals And Guardrails.